Price Strength Index + RSI Buy/Sell ZonesThe Price Strength Index + RSI Buy/Sell Zones indicator is a technical analysis tool designed to evaluate the strength of a financial asset's price movement by comparing it with a series of Volume Weighted Moving Averages (VWMAs) of different lengths calculated from historical data.
Hypothesis :
The core hypothesis behind this indicator is that assessing the relationship between the current price and a range of VWMAs with varying lengths can provide valuable insights into the strength and direction of a price trend. Additionally, it incorporates Relative Strength Index (RSI) conditions to further refine potential buy and sell signals.
How It Works :
Multiple VWMA Calculation: The indicator calculates multiple VWMAs, each with a different length, using historical price data and volume. These VWMAs represent weighted moving averages over various periods, helping to capture different aspects of the price trend.
Comparison with Current Price : For each of these VWMAs, the indicator compares the current bar's price with the VWMA value. This comparison is crucial in understanding how the current price relates to historical averages, shedding light on the strength and direction of the prevailing trend.
SMA of Percentage Above VWMA : The indicator calculates the Simple Moving Average (SMA) of the percentage of prices above the various VWMAs over a specified period. This moving average smoothens out the percentage data, providing a clearer trend signal.
Buy and Sell Zones : User-defined upper and lower thresholds for the percentage of prices above the VWMAs are used to define buy and sell zones. When the percentage falls below the lower threshold, it signals a potential buy zone, suggesting a weakening trend. Conversely, when it exceeds the upper threshold, it signifies a potential sell zone, indicating a strengthening trend.
RSI Integration : The RSI is calculated for the selected price source with a specified length. When the SMA of the percentage above VWMAs falls within the buy zone and the RSI is below the lower RSI threshold, it indicates an oversold condition, potentially signaling a buy opportunity. Conversely, when the SMA falls within the sell zone and the RSI is above the upper RSI threshold, it suggests an overbought condition, possibly signaling a sell opportunity.
Color Coding : The indicator employs color-coding to visually represent the buy and sell zones, as well as extreme RSI conditions. Green color denotes the buy zone, red represents the sell zone, and orange lines indicate the median and potential reversal points.
In summary, the Price Strength Index + RSI Buy/Sell Zones indicator leverages multiple VWMAs of different lengths to assess the relationship between current prices and historical moving averages. This comprehensive analysis, coupled with RSI conditions, aids traders in identifying potential buy and sell zones, as well as extreme RSI points within those zones, enhancing the evaluation of price strength and potential trend reversals.
Cerca negli script per "Buy sell"

EMA with Buy/Sell Signals by lbkindCertainly! Here's a description of the code:
This Pine Script code is designed to plot Exponential Moving Averages (EMAs) on a chart and generate buy/sell signals based on specific conditions. The code includes a filter to reduce false signals by considering the trend of the EMA 200.
The key components of the code are as follows:
1. Input Variables: The code starts by defining input variables such as the periods for the EMAs (ema200Period, ema50Period, ema13Period), the Average True Range period (atrPeriod), and the chopiness threshold (chopinessThreshold).
2. Calculating EMAs: The EMAs (ema200, ema50, ema13) are calculated using the `ema()` function based on the closing price.
3. Average True Range (ATR): The ATR is calculated using the `atr()` function with the specified period (atrPeriod).
4. Normalized ATR: The normalized ATR is computed by dividing the ATR by the closing price and multiplying by 100. This allows for better comparison across different price levels.
5. EMA 200 Trend Direction: The code determines the trend direction of the EMA 200 by comparing the current value with the previous value. The variables `ema200TrendUp` and `ema200TrendDown` are assigned `true` or `false` values based on the trend direction.
6. Generate Buy/Sell Signals: The buySignal is generated when the following conditions are met:
- There is a crossover of the shorter EMAs (ema13, ema50).
- The EMA 200 is in an uptrend (`ema200TrendUp` is true).
- The current close is above the EMA 200.
- The normalized ATR is below the specified chopiness threshold.
The sellSignal is generated when the opposite conditions are met.
7. Plotting: The EMAs (ema200, ema50, ema13) are plotted on the chart using the `plot()` function. The buy and sell signals are plotted as labels using the `plotshape()` function. The buySignal is displayed below the candle (`location=location.belowbar`), and the sellSignal is displayed above the candle (`location=location.abovebar`).
By incorporating these features, the code provides a visual representation of the EMAs, along with buy and sell signals that consider the EMA 200 trend, crossover of shorter EMAs, and the normalized ATR condition. This helps in identifying potential entry and exit points in the market while attempting to reduce false signals.
Buying and Selling Pressure Raw Multi (TG Fork)Visualize raw buying and selling pressure via 3 different calculation methods, all superimposed with dynamic rescaling.
Buying and selling pressure is the concept of quantifying the disproportion between buying and selling. In practice, there is no single definitive way to calculate it.
This indicator is a merge to display three different methods to calculate buying and selling pressure, with automatic visual rescaling to superimpose the three simultaneously, updated to PineScript v5, and with some additional improvements for speed and calculation precisions, and instead of the EMA, other types of moving averages can be used.
I primarily made it for my own needs, but as always, I like sharing with the community, as maybe others may find this useful too.
How to use:
* As often, the goal is to get as many of the 3 signals concur together to get a stronger aggregated signal.
* First signal: If the green bars on the histogram are bigger than the red ones, then there is more buying pressure, and vice versa.
* Second signal: If the background is green, there is more buying pressure, and vice versa if the background is orange. The yellow and green lines define the background color, but they are by default hidden for a less cluttered visual experience.
* Third signal: If the cloud is blue, there is more buying pressure, and the bigger the cloud, the more momentum there is for it to stay (and more difficult it is to reverse to selling pressure). If the cloud is red, there is more selling pressure.
If you like this indicator, please don't give me any credit, instead please show some love to the original authors (in no particular order):
ceyhun:
daytraderph (I could not find the link to the original script, the page is inaccessible?):
www.tradingview.com
fract:

Double wave-trend Oscillator Buy/Sell signalsBINANCE:ROSEUSDT
This script attempts to use Wave Trend Oscillator's of different lengths in order to identify trade entries and exits for bullish trades. This indicator is strongly recommended to be used with volatile assets or on large time interval charts. You use this script by entering a trade when it signals a green block and exiting when it signals red although these signals could potentially be used as trend reversal signals instead. The script uses two wave trend oscillator's the lengths of which can be edited in the settings, but the general idea is that one is fast and one is slow and these indicate when to buy/sell when they crossover the overbought/sold lines. In the setting you can choose whether the fast or the slow line will be used for buy signal and the other is then used to signal selling. By default this will be ticked on indicating that the fast line crossing over the oversold level will be used for buy signals, if it is ticked off the slow line will be used. The other tickbox is for whether the line used for selling will signal when it first crosses over the overbought line or whether it should signal then it crosses back under the overbought line after having crossed over it, the default value is off indicating that it will signal when it crosses back under the overbought level. The overbought/sold levels should be tweaked on a per asset basis to get the best quality signals.
The original code for the Wave Trend Oscillator comes from LazyBear and was modified and built on to create this indicator.
Vol Buy/Sell %s, CMF, and Stocahstic Osc & UOPlots % Buy / Sell Volume , Chaikin Money Flow , Stochastic Oscillator, and Ultimate Oscillator on same axis, bound -1 to 1.
Show Volume Percentage, displaying buying as green and positive, selling as red and negative.
Showing the CMF, with green / red fill for positive / negative values.
Modified Stochastic Oscillator, converting bounds to -1 and 1, moving overbought/sold to -0.6 and 0.6, accordingly. Green fill (buy signal) with %D below -0.6 and %K lower than %D. Red fill (sell signal) with %D above 0.6 and %K higher than %D. Fill is between %D and bound, to be more visible.
Modified Ultimate Oscillator, converting bounds to -1 and 1, moving overbought/sold to -0.6 and 0.6, accordingly.

KINSKI Buy-Sell Signal"KINSKI Buy-Sell Signal" is an Average True Range (ATR) based trailing stop indicator.
In this version, you can change the ATR calculation method using the settings. The default method is hlc3. The HLC stands for High, Low, Close and the /3 divides the result by 3 to give you the average.
The indicator calculates the buy and sell signals using HLC3, Simple Moving Average ( SMA ) and the Exponential Moving Average ( EMA ) as soon as they cross. This indicator is useful with time intervals starting at 15m.
Have fun with it and be careful when buying and selling!
Example Chart:

Dip Buy/Sell Signals (Vix Fix + MA Deviation + TRMAD) [DotGain]Dip Buy/Sell Signals (Vix Fix + MA Deviation + TRMAD)
This indicator combines three proven market stress and mean-reversion components to identify potential buy and sell opportunities during extended market conditions.
────────────────────
📌 Included Components
1️⃣ Volatility-Based Stress Filter (Vix Fix)
Detects short-term market panic using relative price movement.
Signals are generated only during periods of elevated volatility or market stress.
2️⃣ Moving Average Deviation (MA Deviation)
Identifies overbought and oversold conditions based on the percentage deviation from a selected moving average.
Supported MA types:
• EMA
• SMA
• RMA
• VWMA
• WMA
• TEMA
3️⃣ TRMAD (True Range Mean Absolute Deviation)
Measures the distance of price from its mean relative to current volatility.
Useful for filtering extreme price moves and reducing false signals.
────────────────────
📈 Trading Signals
Buy Signal:
• Elevated market volatility
• Price significantly below the moving average
• TRMAD below the defined threshold
Sell Signal:
• Elevated market volatility
• Price significantly above the moving average
• TRMAD above the defined threshold
Signals are visualized directly on the chart:
• Buy: green label below the candle
• Sell: red label above the candle
────────────────────
⚙️ Settings & Customization
All components are fully adjustable:
• Lookback periods
• Moving average types and lengths
• Volatility and threshold levels
This makes the indicator suitable for:
• Intraday trading
• Swing trading
• Crypto, Forex, indices, and equities
────────────────────
Disclaimer
This "Dip Buy/Sell Signals (Vix Fix + MA Deviation + TRMAD)" (DipSig) indicator is provided for informational and educational purposes only. It does not, and should not be construed as, financial, investment, or trading advice.
The signals generated by this tool (both "Buy" and "Sell") are the result of a specific set of algorithmic conditions. They are not a direct recommendation to buy or sell any asset. All trading and investing in financial markets involves substantial risk of loss. You can lose all of your invested capital.
Past performance is not indicative of future results. The signals generated may produce false or losing trades. The creator (© DotGain) assumes no liability for any financial losses or damages you may incur as a result of using this indicator.
You are solely responsible for your own trading and investment decisions. Always conduct your own research (DYOR) and consider your personal risk tolerance before making any trades.

HMA Pivot Buy/Sell (only) + AlertsThis Pine Script is a lightweight indicator that plots only HMA-based pivot Buy/Sell signals and provides alert conditions for them.
What it does
Calculates a Hull Moving Average (HMA) using either:
a dynamic length based on the chart timeframe, or
a custom user-defined length.
Detects HMA pivot points (local turning points):
Buy signal when the HMA forms a local minimum (trend turns up).
Sell signal when the HMA forms a local maximum (trend turns down).
Optionally plots the HMA line and prints only the Buy/Sell markers on the chart (no extra arrows/emoji/labels from other systems).
Adds TradingView alerts for Buy, Sell, and combined Buy/Sell events.
Signal logic
Buy (HMA Pivot Low) triggers when:
HMA > HMA and HMA < HMA
Meaning: the HMA was falling, formed a bottom, and has started rising.
Sell (HMA Pivot High) triggers when:
HMA < HMA and HMA > HMA
Meaning: the HMA was rising, formed a top, and has started falling.
Inputs
Source: price source used to compute HMA (default: close).
Use Custom HMA Length: enables manual override.
Custom HMA Length: manual HMA period (default: 55).
Alerts: only on bar close:
If enabled, alerts fire only after the bar closes (confirmed signals).
If disabled, alerts can fire intrabar (faster but less stable).
Draw signal on pivot bar (offset -1):
If enabled, markers are drawn on the pivot bar (one bar back) using offset = -1.
If disabled, markers are drawn on the confirmation bar (no offset).
Show HMA line: toggles display of the HMA line.
Alerts available
BUY (HMA Pivot) — triggers on Buy signal.
SELL (HMA Pivot) — triggers on Sell signal.
BUY/SELL (HMA Pivot) — triggers on either Buy or Sell.
Each alert message includes ticker, timeframe, and close price via placeholders:
{{ticker}}, {{interval}}, {{close}}.

SCOTTGO - Buy Sell Volume📊 SCOTTGO - Buy Sell Volume Bars - Delta - Up Down Volume Bars
This indicator disaggregates the total volume traded on each bar into estimated Buying Volume and Selling Volume to visualize market pressure and dominance directly in a dedicated sub-pane.
Key Features:
Volume Disaggregation: Uses a standard formula to estimate how much of a bar's total volume was associated with upward (buying) pressure and how much was associated with downward (selling) pressure.
Visual Clarity: Plots the Buy Volume (teal, upward) and Sell Volume (red, downward) as separate columns against a transparent total volume background, allowing for quick assessment of pressure balance.
Real-Time Badge: A dynamic badge is fixed to the corner of the chart (default: Top Right) providing a numeric summary of the latest bar:
Buy %: Percentage of the bar's total volume estimated as Buying Volume.
Sell %: Percentage of the bar's total volume estimated as Selling Volume.
Delta %: The magnitude of the volume difference (Delta) as a percentage of total volume, indicating the strength of the dominant side.
Dominance Indicator: The background color of the badge changes dynamically to immediately signal whether Buying (customizable color, default: Teal) or Selling (customizable color, default: Red) pressure was dominant on the current bar.
Usage:
Traders can use this tool to identify periods of heavy accumulation (high Buy Volume) or distribution (high Sell Volume), providing insight into the conviction behind price movements.

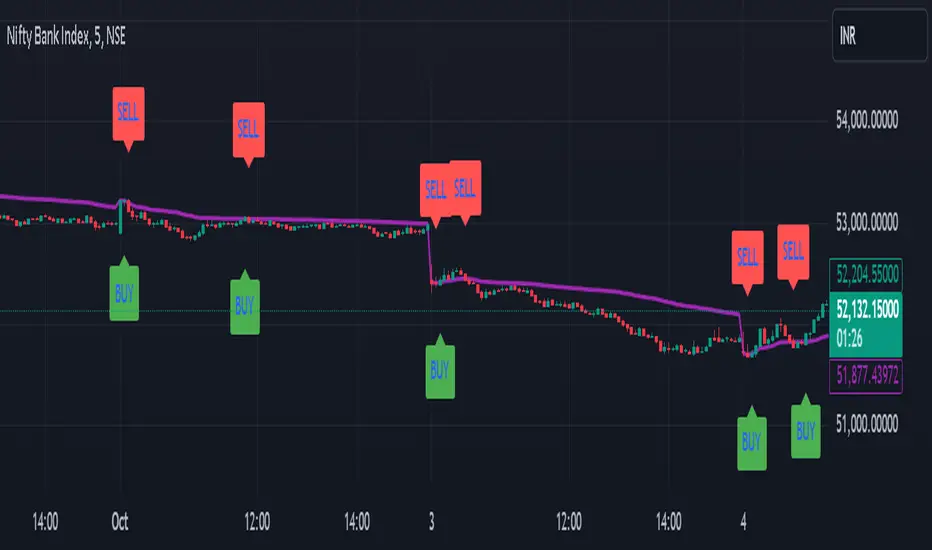
Algo Trading Signals - Buy/Sell System# 📊 Algo Trading Signals - Dynamic Buy/Sell System
## 🎯 Overview
**Algo Trading Signals** is a sophisticated intraday trading indicator designed for algorithmic traders and active day traders. This system generates precise buy and sell signals based on a dynamic box breakout strategy with intelligent position management, add-on entries, and automatic target adjustment.
The indicator creates a reference price box during a specified time window (default: 9:15 AM - 9:45 AM IST) and generates high-probability signals when price breaks out of this range with confirmation.
---
## ✨ Key Features
### 📍 **Smart Signal Generation**
- **Primary Entry Signals**: Clear buy/sell signals on confirmed breakouts above/below the reference box
- **Confirmation Bars**: Reduces false signals by requiring multiple bar confirmation before entry
- **Cooldown System**: Prevents overtrading with configurable cooldown periods between trades
- **Add-On Positions**: Automatically identifies optimal pullback entries for scaling into positions
### 📦 **Dynamic Reference Box**
- Creates a high/low range during your chosen time window
- Automatically updates after each successful trade
- Visual box display with color-coded boundaries (red=resistance, green=support)
- Mid-level reference line for market structure analysis
### 🎯 **Intelligent Position Management**
- **Automatic Target Calculation**: Sets profit targets based on average move distance
- **Add-On System**: Up to 3 additional entries on optimal pullbacks
- **Position Tracking**: Monitors active trades and remaining add-on capacity
- **Auto Box Shift**: Adjusts reference box after target hits for continued trading
### 📊 **Visual Clarity**
- **Color-Coded Labels**:
- 🟢 Green for BUY signals
- 🔴 Red for SELL signals
- 🔵 Blue for ADD-ON buys
- 🟠 Orange for ADD-ON sells
- ✓ Yellow for Target hits
- **TP Level Lines**: Dotted lines showing current profit targets
- **Hover Tooltips**: Detailed information on entry prices, targets, and add-on numbers
### 📈 **Real-Time Statistics**
Live performance dashboard showing:
- Total buy and sell signals generated
- Number of add-on positions taken
- Take profit hits achieved
- Current trade status (LONG/SHORT/None)
- Cooldown timer status
### 🔔 **Comprehensive Alerts**
Built-in alert conditions for:
- Primary buy entry signals
- Primary sell entry signals
- Add-on buy positions
- Add-on sell positions
- Buy take profit hits
- Sell take profit hits
---
## 🛠️ Configuration Options
### **Time Settings**
- **Box Start Hour/Minute**: Define when to begin tracking the reference range
- **Box End Hour/Minute**: Define when to lock the reference box
- **Default**: 9:15 AM - 9:45 AM (IST) - Perfect for Indian market opening range
### **Trade Settings**
- **Target Points (TP)**: Average move distance for profit targets (default: 40 points)
- **Breakout Confirmation Bars**: Number of bars to confirm breakout (default: 2)
- **Cooldown After Trade**: Bars to wait after closing position (default: 3)
- **Add-On Distance Points**: Minimum pullback for add-on entry (default: 40 points)
- **Max Add-On Positions**: Maximum additional positions allowed (default: 3)
### **Display Options**
- Toggle buy/sell signal labels
- Show/hide trading box visualization
- Show/hide TP level lines
- Show/hide statistics table
---
## 💡 How It Works
### **Phase 1: Box Formation (9:15 AM - 9:45 AM)**
The indicator tracks the high and low prices during your specified time window to create a reference box representing the opening range.
### **Phase 2: Breakout Detection**
After the box is locked, the system monitors for:
- **Bullish Breakout**: Price closes above box high for confirmation bars
- **Bearish Breakout**: Price closes below box low for confirmation bars
### **Phase 3: Signal Generation**
When confirmation requirements are met:
- Entry signal is generated with clear visual label
- Target price is calculated (Entry ± Target Points)
- Position tracking activates
- Cooldown timer starts
### **Phase 4: Position Management**
During active trade:
- **Add-On Logic**: If price pulls back by specified distance but stays within favorable range, additional entry signal fires
- **Target Monitoring**: Continuously checks if price reaches TP level
- **Box Adjustment**: After TP hit, box automatically shifts to new range for next opportunity
### **Phase 5: Trade Exit & Reset**
On target hit:
- Position closes with TP marker
- Statistics update
- Box repositions for next setup
- Cooldown activates
- System ready for next signal
---
## 📌 Best Use Cases
### **Ideal For:**
- ✅ Intraday breakout trading strategies
- ✅ Algorithmic trading systems (via alerts/webhooks)
- ✅ Opening range breakout (ORB) strategies
- ✅ Index futures (Nifty, Bank Nifty, Sensex)
- ✅ High-liquidity stocks with clear ranges
- ✅ Automated trading bots
- ✅ Scalping and day trading
### **Markets:**
- Indian Stock Market (NSE/BSE)
- Futures & Options
- Forex pairs
- Cryptocurrency (adjust timing for 24/7 markets)
- Global indices
---
## ⚙️ Integration with Algo Trading
This indicator is **algo-ready** and can be integrated with automated trading systems:
1. **TradingView Alerts**: Set up alert conditions for each signal type
2. **Webhook Integration**: Connect alerts to trading platforms via webhooks
3. **API Automation**: Use with brokers supporting TradingView integration (Zerodha, Upstox, Interactive Brokers, etc.)
4. **Signal Data Access**: All signals are plotted for external data retrieval
---
## 📖 Quick Start Guide
1. **Add Indicator**: Apply to your chart (works best on 1-5 minute timeframes)
2. **Configure Time Window**: Set your desired box formation period
3. **Adjust Parameters**: Tune confirmation bars, targets, and add-on settings to your trading style
4. **Set Alerts**: Create alert conditions for automated notifications
5. **Backtest**: Review historical signals to validate strategy performance
6. **Go Live**: Enable alerts and start receiving real-time trading signals
---
## ⚠️ Risk Disclaimer
This indicator is a **tool for analysis** and does not guarantee profits. Trading involves substantial risk of loss. Always:
- Use proper position sizing
- Implement stop losses (not included in this indicator)
- Test thoroughly before live trading
- Understand market conditions
- Never risk more than you can afford to lose
- Consider your risk tolerance and trading experience
**Past performance does not indicate future results.**
## 🔄 Version History
**v1.0** - Initial Release
- Dynamic box formation system
- Confirmed breakout signals
- Add-on position management
- Visual signal labels and statistics
- Comprehensive alert system
- Auto-adjusting target boxes
---
## 📞 Support & Feedback
If you find this indicator helpful:
- ⭐ Please leave a like/favorite
- 💬 Share your feedback in comments
- 📊 Share your results and improvements
- 🤝 Suggest features for future updates
---
## 🏷️ Tags
`breakout` `daytrading` `signals` `algo` `automated` `intraday` `ORB` `opening-range` `buy-sell` `scalping` `futures` `nifty` `banknifty` `algorithmic` `box-strategy`
*Remember: The best indicator is combined with proper risk management and trading discipline.* Use it at your own rist, not as financial advie

Heikinisi Candle (With MA + Smoothing + Buy/Sell with Cooldown)This custom Heikinisi Candle (With MA + Smoothing + Buy/Sell with Cooldown) indicator combines the advantages of Heikin-Ashi candles with the flexibility of multiple moving averages and smoothing options. The built-in buy/sell signals with cooldown functionality help traders avoid overtrading while capturing trend reversals and momentum shifts. Whether you're a day trader, swing trader, or long-term investor, this indicator offers powerful tools for analyzing price action and making informed trading decisions.
Note: Disable the regular candle to get better visualization.
Key Features:
Custom Heikin-Ashi Candles:
The core feature of this script is the Heikin-Ashi candles, which are known for smoothing price action and helping traders identify market trends more clearly.
Unlike traditional Heikin-Ashi, this version adjusts the Heikin-Ashi close based on specific price action patterns, including rejection signals and engulfing patterns.
The custom Heikin-Ashi open also incorporates momentum, adjusting dynamically based on recent price changes.
Price Action Measurements:
The indicator measures key price action components, including:
Body: The absolute difference between the open and close.
Candle Range: The total range from high to low.
Upper Wick: The distance from the highest price to the maximum of open or close.
Lower Wick: The distance from the lowest price to the minimum of open or close.
These measurements help detect bullish and bearish conditions, as well as price rejection signals.
Buy/Sell Signal Logic:
Buy Signal: Triggered when the Heikin-Ashi close is above the chosen moving average (MA1), with a cooldown period to avoid too frequent signals.
Sell Signal: Triggered when the Heikin-Ashi close falls below the MA1 after a buy signal has already been issued.
The cooldown period ensures that buy and sell signals are spaced apart by a specific number of bars, preventing excessive signal generation during periods of price consolidation.
Multiple Moving Averages (MA):
This script supports up to three customizable moving averages (MA1, MA2, MA3), each of which can be set to different types and lengths, including:
Simple Moving Average (SMA)
Exponential Moving Average (EMA)
Weighted Moving Average (WMA)
Volume Weighted Moving Average (VWMA)
Volume Weighted Moving Price (VWMP)
Least Squares Moving Average (LSMA)
Hull Moving Average (HMA)
Double Exponential Moving Average (DEMA)
Triple Exponential Moving Average (TEMA)
Users can adjust the length and type of each MA for tailored analysis.
Smoothing Options for MAs:
Users can smooth the output of MAs using various types of smoothing algorithms (SMA, EMA, LSMA, WMA, Gaussian) and a customizable length. This helps to reduce noise in the moving average lines and provides clearer signals.
Gaussian Filter (Advanced Smoothing):
A Gaussian Filter is available as a smoothing option for MAs. This filter reduces noise and makes the moving averages smoother, which can be particularly helpful in volatile or choppy markets.
Alerts and Visualization:
The script allows users to plot buy and sell signals on the chart with distinctive markers. A Buy Signal is shown below the bar with a lime green marker and text "Buy," while a Sell Signal is shown above the bar with a red marker and text "Sell."
Traders can also set up alerts based on the buy/sell signals to get notified in real time.
Indicator Configuration:
Heikin-Ashi Candle Configuration:
Automatically adjusts Heikin-Ashi candles based on rejection signals, engulfing patterns, and momentum. It uses custom formulas for the Heikin-Ashi open and close, making it more sensitive to price action than standard Heikin-Ashi candles.
Moving Averages (MA) Configuration:
You can select from multiple moving average types and lengths (MA1, MA2, MA3) for trend-following analysis.
Choose between SMA, EMA, WMA, VWMA, VWMP, LSMA, HMA, DEMA, and TEMA.
Smoothing Options:
Enable or disable smoothing for the moving averages.
Select from different smoothing types, including SMA, EMA, RMA, WMA, LSMA, and Gaussian.
Cooldown Period:
Control the number of bars that must pass before a new buy/sell signal is triggered. This cooldown period helps prevent excessive trading signals in quick succession.
How to Use:
Analyze Price Action with Heikin-Ashi Candles:
The custom Heikin-Ashi candles are ideal for spotting market trends, reversals, and price rejection. Use the candle patterns to gauge the market sentiment.
Use MAs for Trend Confirmation:
The moving averages (MA1, MA2, MA3) can help identify the prevailing trend. A price above a rising MA indicates an uptrend, while a price below a falling MA suggests a downtrend.
Trigger Buy and Sell Signals:
When the Heikin-Ashi close crosses above MA1, a buy signal is triggered.
When the Heikin-Ashi close crosses below MA1 after a buy signal, a sell signal is triggered.
The cooldown period ensures that signals are spaced out, preventing overtrading.
Use Smoothing for Clearer Signals:
If you are trading in a volatile market, you can use the smoothing options to make the MAs smoother and reduce noise.

Volume Buy/Sell ChartVolume Buy/Sell Chart
This script visualizes the distribution of buying and selling volume within each candlestick, helping traders identify dominant market pressure at a glance. It separates volume into Buy Volume (Green) and Sell Volume (Red) using a unique calculation based on price movement within a candle.
Features:
✅ Customizable Bar Display: Choose to display 5, 10, or 100 bars using a simple dropdown selection.
✅ Buy & Sell Volume Calculation: The script determines buying and selling volume dynamically based on price action within the candle.
✅ Custom Volume Threshold for Alerts: Set a percentage threshold (0–100) to trigger alerts when buy or sell volume exceeds a predefined level.
✅ Color-Coded Histogram:
Green Bars: Represent the estimated buy volume.
Red Bars: Represent the estimated sell volume.
✅ Alerts Integration: Automatically detect strong buy or sell signals when the respective volume percentage exceeds your set threshold.
How It Works:
The script calculates total price movement within a candle.
It then estimates buying and selling volume ratios based on whether the price closes higher or lower than it opened.
Finally, it normalizes the buy/sell volume against the total volume and plots it as a column chart.
Usage Guide:
Add the script to your chart.
Select how many bars to display (5, 10, or 100).
Adjust the Custom Volume Percentage Threshold (default: 75%).
Watch for significant buy/sell volume imbalances that might indicate market turning points!
This tool is great for traders looking to analyze volume flow and market sentiment with a simple yet effective visualization. 🚀
Moving Average with Buy/Sell SignalsBINANCE:BTCUSD
Pine Script Brief: "44 Moving Average with Buy/Sell Signals"
This Pine Script is designed to generate buy and sell signals based on the interaction of the price with the 44-period Simple Moving Average (SMA). It also considers the closing behavior of the last five candles to further refine the conditions for generating signals. The script is intended for use in technical analysis for trading strategies on platforms like TradingView.
Features:
44-Period Simple Moving Average (SMA):
The script calculates and plots the 44-period SMA of the closing price on the chart, providing a trend-following indicator.
The SMA is used as a key level to determine when price action is "touching" or interacting with the moving average.
Buy and Sell Signal Logic:
Buy Signal:
The candle is green (close > open).
The candle's high and low are around the 44 SMA, indicating the candle is "touching" or near the moving average.
At least 2 of the last 5 candles must have closed above the 44 SMA.
The 44 SMA is positioned below the midpoint of the current candle.
Sell Signal:
The candle is red (close < open).
The candle's high and low are around the 44 SMA.
At least 2 of the last 5 candles must have closed below the 44 SMA.
The 44 SMA is positioned above the midpoint of the current candle.
Label Plotting:
The script uses the plotSignal function to plot buy and sell labels directly on the chart. The labels are plotted at the low of a green candle (for buy signals) and the high of a red candle (for sell signals).
Labels are color-coded for quick identification: green for buy and red for sell.
EMA for Smoothing (Optional):
An optional Exponential Moving Average (EMA) is plotted for additional trend smoothing, allowing users to visualize another moving average for possible trend-following strategies.
The length of the EMA is customizable, and it is plotted on the chart alongside the 44 SMA.
Alert Conditions:
Alerts can be set up for both buy and sell signals, notifying the user when these conditions are met. The alerts are triggered whenever the script detects a valid buy or sell signal.
Customizable Inputs:
The script allows customization of the following:
Smoothing Length: For the optional EMA line.
Tolerance: For adjusting the proximity check (candle touching the 44 SMA).
Styling: The color and text of the buy and sell labels can be customized.
Usage:
This script can be used by traders who want to identify possible entry and exit points based on price interaction with the 44-period moving average, combined with the behavior of previous candles. It is suitable for trend-following strategies and can be used in conjunction with other indicators to refine trading decisions.
Key Benefits:
Provides visual signals (buy/sell) directly on the chart.
Considers both immediate price action and historical trends (previous candles).
Offers customization for moving averages and labels.
Alerts can be set for automated notifications.
This Pine Script helps traders make informed decisions by combining the reliability of moving averages with price action and historical candle behavior, enhancing trading strategies based on trend-following principles.
Multifactor Buy/Sell Strategy V2 | RSI, MACD, ATR, EMA, Boll.BITGET:1INCHUSDT
This Pine Script code for TradingView is a multifactor Buy/Sell indicator that combines several technical factors to generate trading signals based on trend, volatility, and volume conditions. Here’s a breakdown of the main components and functionality:
Indicator Name
- Multifactor Buy/Sell Strategy V2 — an overlay indicator applied directly on the price chart.
### Input Parameters
The script includes multiple customizable parameters:
- RSI, EMA, MACD parameters — for setting periods and signals of MACD and RSI.
- ATR and Bollinger Bands — used for volatility analysis and level determination.
- Minimum Volatility Threshold — sets a minimum Bollinger Band width threshold for determining high volatility.
Core Indicators
1. RSI — calculated to identify oversold (below 30) and overbought (above 70) conditions.
2. EMA and MACD — calculates exponential moving averages and MACD histogram to determine trend direction.
3. ATR and Bollinger Bands — used to assess current volatility and establish dynamic upper and lower bands.
Volatility and Volume Analysis
- Determines the current ATR level and Bollinger Band width to evaluate high volatility.
- Calculates the volume moving average to track periods of increased volume during high volatility.
Trend Analysis
The script uses the difference between fast and slow EMAs to define strong trends:
- Uptrend — when the fast EMA is above the slow EMA, the price is above the fast EMA, and the trend is strong.
- Downtrend — when the fast EMA is below the slow EMA, the price is below the fast EMA, and the trend is strong.
Momentum Filter
- Based on the price change over the last three bars and compared against the minimum volatility threshold to identify strong momentum.
Buy and Sell Signal Generation
- Buy Signal: Uptrend with RSI oversold, positive MACD histogram, high volatility and volume, strong momentum, and sufficient Bollinger Band width.
- Sell Signal: Downtrend with RSI overbought, negative MACD histogram, high volatility and volume, strong momentum, and sufficient Bollinger Band width.
Visualization
- Buy and sell signals are displayed as green and red triangles on the chart.
- Plots for fast and slow EMAs, upper and lower bands, and Bollinger Bands.
Alerts
The script includes alert conditions for buy and sell signals, allowing notifications to be sent via email or mobile app.
Information Panel
A small table on the chart displays current volatility dataThis Pine Script code for TradingView is a multifactor Buy/Sell indicator that combines several technical factors to generate trading signals based on trend, volatility, and volume conditions. Here’s a breakdown of the main components and functionality:
Indicator Name
- Multifactor Buy/Sell Strategy V2 — an overlay indicator applied directly on the price chart.
Input Parameters
The script includes multiple customizable parameters:
- **RSI, EMA, MACD parameters** — for setting periods and signals of MACD and RSI.
- **ATR and Bollinger Bands** — used for volatility analysis and level determination.
- **Minimum Volatility Threshold** — sets a minimum Bollinger Band width threshold for determining high volatility.
Core Indicators
1. RSI — calculated to identify oversold (below 30) and overbought (above 70) conditions.
2. EMA and MACD — calculates exponential moving averages and MACD histogram to determine trend direction.
3. ATR and Bollinger Bands — used to assess current volatility and establish dynamic upper and lower bands.
Volatility and Volume Analysis
- Determines the current ATR level and Bollinger Band width to evaluate high volatility.
- Calculates the volume moving average to track periods of increased volume during high volatility.
Trend Analysis
The script uses the difference between fast and slow EMAs to define strong trends:
- Uptrend — when the fast EMA is above the slow EMA, the price is above the fast EMA, and the trend is strong.
- Downtrend — when the fast EMA is below the slow EMA, the price is below the fast EMA, and the trend is strong.
Momentum Filter
- Based on the price change over the last three bars and compared against the minimum volatility threshold to identify strong momentum.
Buy and Sell Signal Generation
- Buy Signal: Uptrend with RSI oversold, positive MACD histogram, high volatility and volume, strong momentum, and sufficient Bollinger Band width.
- Sell Signal: Downtrend with RSI overbought, negative MACD histogram, high volatility and volume, strong momentum, and sufficient Bollinger Band width.
Visualization
- Buy and sell signals are displayed as green and red triangles on the chart.
- Plots for fast and slow EMAs, upper and lower bands, and Bollinger Bands.
Alerts
The script includes alert conditions for buy and sell signals, allowing notifications to be sent via email or mobile app.
Information Panel
A small table on the chart displays current volatility
- Volatility Status — indicates high or low volatility.
- Bollinger Band Width — current width as a percentage.
- ATR Ratio — ratio of current ATR to long-term average ATR.
This script is suitable for trading in high-volatility conditions, combining multiple filters and factors to generate precise buy and sell signals.

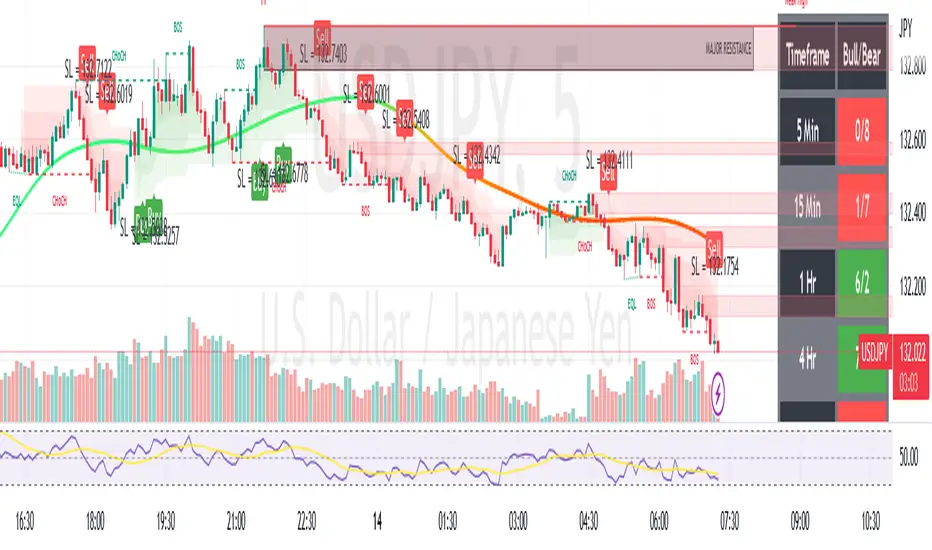
Stoch RSI and RSI Buy/Sell Signals with MACD Trend FilterDescription of the Indicator
This Pine Script is designed to provide traders with buy and sell signals based on the combination of Stochastic RSI, RSI, and MACD indicators, enhanced by the confirmation of candle colors. The primary goal is to facilitate informed trading decisions in various market conditions by utilizing different indicators and their interactions. The script allows customization of various parameters, providing flexibility for traders to adapt it to their specific trading styles.
Usefulness
This indicator is not just a mashup of existing indicators; it integrates the functionality of multiple momentum and trend-detection methods into a cohesive trading tool. The combination of Stochastic RSI, RSI, and MACD offers a well-rounded approach to analyzing market conditions, allowing traders to identify entry and exit points effectively. The inclusion of color-coded signals (strong vs. weak) further enhances its utility by providing visual cues about the strength of the signals.
How to Use This Indicator
Input Settings: Adjust the parameters for the Stochastic RSI, RSI, and MACD to fit your trading style. Set the overbought/oversold levels according to your risk tolerance.
Signal Colors:
Strong Buy Signal: Indicated by a green label and confirmed by a green candle (close > open).
Weak Buy Signal: Indicated by a blue label and confirmed by a green candle (close > open).
Strong Sell Signal: Indicated by a red label and confirmed by a red candle (close < open).
Weak Sell Signal: Indicated by an orange label and confirmed by a red candle (close < open).
Example Trading Strategy Using This Indicator
To effectively use this indicator as part of your trading strategy, follow these detailed steps:
Setup:
Timeframe : Select a timeframe that aligns with your trading style (e.g., 15-minute for intraday, 1-hour for swing trading, or daily for longer-term positions).
Indicator Settings : Customize the Stochastic RSI, RSI, and MACD parameters to suit your trading approach. Adjust overbought/oversold levels to match your risk tolerance.
Strategy:
1. Strong Buy Entry Criteria :
Wait for a strong buy signal (green label) when the RSI is at or below the oversold level (e.g., ≤ 35), indicating a deeply oversold market. Confirm that the MACD shows a decreasing trend (bearish momentum weakening) to validate a potential reversal. Ensure the current candle is green (close > open) if candle color confirmation is enabled.
Example Use : On a 1-hour chart, if the RSI drops below 35, MACD shows three consecutive bars of decreasing negative momentum, and a green candle forms, enter a buy position. This setup signals a robust entry with strong momentum backing it.
2. Weak Buy Entry Criteria :
Monitor for weak buy signals (blue label) when RSI is above the oversold level but still below the neutral (e.g., between 36 and 50). This indicates a market recovering from an oversold state but not fully reversing yet. These signals can be used for early entries with additional confirmations, such as support levels or higher timeframe trends.
Example Use : On the same 1-hour chart, if RSI is at 45, the MACD shows momentum stabilizing (not necessarily negative), and a green candle appears, consider a partial or cautious entry. Use this as an early warning for a potential bullish move, especially when higher timeframe indicators align.
3. Strong Sell Entry Criteria :
Look for a strong sell signal (red label) when RSI is at or above the overbought level (e.g., ≥ 65), signaling a strong overbought condition. The MACD should show three consecutive bars of increasing positive momentum to indicate that the bullish trend is weakening. Ensure the current candle is red (close < open) if candle color confirmation is enabled.
Example Use : If RSI reaches 70, MACD shows increasing momentum that starts to level off, and a red candle forms on a 1-hour chart, initiate a short position with a stop loss set above recent resistance. This is a high-confidence signal for potential price reversal or pullback.
4. Weak Sell Entry Criteria :
Use weak sell signals (orange label) when RSI is between the neutral and overbought levels (e.g., between 50 and 64). These can indicate potential short opportunities that might not yet be fully mature but are worth monitoring. Look for other confirmations like resistance levels or trendline touches to strengthen the signal.
Example Use : If RSI reads 60 on a 1-hour chart, and the MACD shows slight positive momentum with signs of slowing down, place a cautious sell position or scale out of existing long positions. This setup allows you to prepare for a possible downtrend.
Trade Management:
Stop Loss : For buy trades, place stop losses below recent swing lows. For sell trades, set stops above recent swing highs to manage risk effectively.
Take Profit : Target nearby resistance or support levels, apply risk-to-reward ratios (e.g., 1:2), or use trailing stops to lock in profits as price moves in your favor.
Confirmation : Align these signals with broader trends on higher timeframes. For example, if you receive a weak buy signal on a 15-minute chart, check the 1-hour or daily chart to ensure the overall trend is not bearish.
Real-World Example: Imagine trading on a 15-minute chart :
For a buy:
A strong buy signal (green) appears when the RSI dips to 32, MACD shows declining bearish momentum, and a green candle forms. Enter a buy position with a stop loss below the most recent support level.
Alternatively, a weak buy signal (blue) appears when RSI is at 47. Use this as a signal to start monitoring the market closely or enter a smaller position if other indicators (like support and volume analysis) align.
For a sell:
A strong sell signal (red) with RSI at 72 and a red candle signals to short with conviction. Place your stop loss just above the last peak.
A weak sell signal (orange) with RSI at 62 might prompt caution but can still be acted on if confirmed by declining volume or touching a resistance level.
These strategies show how to blend both strong and weak signals into your trading for more nuanced decision-making.
Technical Analysis of the Code
1. Stochastic RSI Calculation:
The script calculates the Stochastic RSI (stochRsiK) using the RSI as input and smooths it with a moving average (stochRsiD).
Code Explanation : ta.stoch(rsi, rsi, rsi, stochLength) computes the Stochastic RSI, and ta.sma(stochRsiK, stochSmoothing) applies smoothing.
2. RSI Calculation :
The RSI is computed over a user-defined period and checks for overbought or oversold conditions.
Code Explanation : rsi = ta.rsi(close, rsiLength) calculates RSI values.
3. MACD Trend Filter :
MACD is calculated with fast, slow, and signal lengths, identifying trends via three consecutive bars moving in the same direction.
Code Explanation : = ta.macd(close, macdLengthFast, macdLengthSlow, macdSignalLength) sets MACD values. Conditions like macdLine < macdLine confirm trends.
4. Buy and Sell Conditions :
The script checks Stochastic RSI, RSI, and MACD values to set buy/sell flags. Candle color filters further confirm valid entries.
Code Explanation : buyConditionMet and sellConditionMet logically check all conditions and toggles (enableStochCondition, enableRSICondition, etc.).
5. Signal Flags and Confirmation :
Flags track when conditions are met and ensure signals only appear on appropriate candle colors.
Code Explanation : Conditional blocks (if statements) update buyFlag and sellFlag.
6. Labels and Alerts :
The indicator plots "BUY" or "SELL" labels with the RSI value when signals trigger and sets alerts through alertcondition().
Code Explanation : label.new() displays the signal, color-coded for strength based on RSI.
NOTE : All strategies can be enabled or disabled in the settings, allowing traders to customize the indicator to their preferences and trading styles.

Cumulative Volume Delta with VWAP-based Buy/Sell AlertsDescription:
This script combines Cumulative Volume Delta (CVD) with Volume Weighted Average Price (VWAP) to generate buy and sell signals. It plots both the cumulative volume delta and its moving average on the chart, but the actual buy and sell signals are now based on the crossover and crossunder of the price with the VWAP, a popular tool for tracking price relative to the volume-weighted average over time.
Features:
Cumulative Volume Delta (CVD) Plot:
CVD helps visualize the net buying or selling pressure by accumulating volume when the price is rising and subtracting it when the price is falling. The cumulative volume is plotted on the chart as a blue line.
Moving Average of CVD:
A simple moving average (SMA) of the cumulative volume delta is plotted in orange to smooth out fluctuations and help detect the trend of volume flow.
VWAP Calculation:
VWAP (Volume Weighted Average Price) is a standard benchmark widely used in trading. It gives insight into whether the price is trading above or below the average price at which most of the volume has traded, weighted by volume. The VWAP is plotted as a purple line on the chart.
Buy/Sell Signals Based on VWAP:
Buy Signal: Triggered when the price crosses above the VWAP, indicating potential upward momentum.
Sell Signal: Triggered when the price crosses below the VWAP, signaling potential downward momentum.
These signals are displayed on the chart with clear labels:
Buy Signal: A green upward label appears below the price.
Sell Signal: A red downward label appears above the price.
Alerts for Buy/Sell Conditions:
Alerts are built into the script, so traders can receive notifications when the following conditions are met:
Buy Alert: The price crosses above the VWAP.
Sell Alert: The price crosses below the VWAP.
Use Case:
This script is useful for traders looking to incorporate both volume-based indicators and the VWAP into their trading strategy. The combination of CVD and VWAP provides a more comprehensive view of both price and volume dynamics:
VWAP helps traders understand whether the price is trading above or below its volume-weighted average.
CVD highlights buying or selling pressure through cumulative volume analysis.
Customization:
Anchor Periods: The user can customize the anchor period to suit different timeframes and trading styles.
Custom Alerts: The alert conditions can be easily modified to integrate into any trader’s strategy.
This script can be adapted for both short-term and long-term trading strategies and is especially useful in high-volume markets.
How to Use:
Add the script to your TradingView chart.
Customize the timeframe and anchor period, if needed, to match your preferred trading style.
Watch for Buy/Sell signals based on price crossing the VWAP.
Set up alerts to receive notifications when Buy or Sell signals are triggered.
This script is designed to help traders make informed decisions based on both price action relative to volume and Cumulative Delta volume trends, giving a more comprehensive view of the market dynamics.
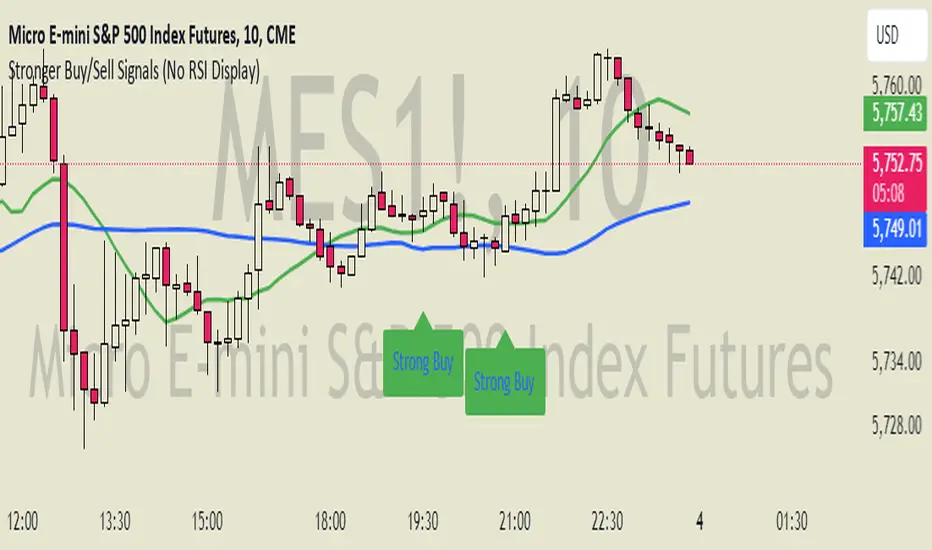
Stronger Buy/Sell Signals This custom Pine Script indicator is designed to detect strong buy and sell signals based on price action trends and momentum, with an emphasis on using two simple moving averages (SMAs) for trend identification and RSI (Relative Strength Index) impulses for additional confirmation. The script is optimized to ensure that signals are not triggered too frequently, only highlighting strong trend-based opportunities. Additionally, the script is built as an overlay to keep the chart clean and prevent any visual shrinking caused by extra indicators.
Key Features
1. Moving Averages (SMAs):
- 11-period SMA (short-term trend): This moving average is used to track short-term price movement and serves as the primary trend filter.
- 50-period SMA (medium-term trend): This moving average is used to track the medium-term price trend, providing additional confirmation for trend direction.
The price must be above both SMAs for a buy signal or below both SMAs for a sell signal, ensuring that signals are only triggered in well-defined trends.
2. RSI Momentum Confirmation:
- Although the RSI is not displayed on the chart, it plays a critical role in filtering the signals.
- The RSI is calculated using the standard 14-period formula, and an additional condition requires that the RSI must show an upward or downward momentum (impulse) for buy or sell signals, respectively.
- The RSI impulse is measured by comparing the RSI value to its 5-period moving average:
- Upward impulse for a buy signal.
- Downward impulse for a sell signal.
3. Buy Signal:
- A strong buy signal is triggered when:
- The price is above both the 11-period and 50-period SMAs (confirming a bullish trend).
- The RSI is showing upward momentum, implying growing buying pressure.
- When both of these conditions are met, a green "Strong Buy" label will appear below the price bars, indicating a strong buying opportunity.
4. Sell Signal:
- A strong sell signal is triggered when:
- The price is below both the 11-period and 50-period SMAs (confirming a bearish trend).
- The RSI is showing downward momentum, implying growing selling pressure.
- When both of these conditions are met, a red "Strong Sell" label will appear above the price bars, indicating a strong selling opportunity.
5. No RSI Display:
- While the RSI is used for internal signal filtering, it is not displayed on the chart. This decision ensures that the chart remains uncluttered, with only the important buy/sell signals and moving averages visible.
6. Overlay-Only Indicator:
- This script is designed as an overlay indicator, meaning it plots directly on the price chart without adding additional panes. This helps the chart maintain its size and avoids shrinking the view.
---
Use Case
This indicator is ideal for traders who want to:
- Focus on strong, trend-confirming signals while avoiding noise from weaker setups.
- Trade in alignment with the trend , as defined by both short-term (11-SMA) and medium-term (50-SMA) price action.
- Filter signals based on momentum without cluttering their charts with additional indicators.
Customization Options
- SMA Periods : You can adjust the periods for the 11-SMA and 50-SMA depending on your preferred timeframe and trading strategy.
- RSI Conditions : If you want to add or remove sensitivity from the buy and sell signals, you can modify the RSI impulse logic to adjust the thresholds for what qualifies as an upward or downward impulse.
---
Conclusion
The "Stronger Buy/Sell Signals" Pine Script is a powerful trend-following tool that uses a combination of moving averages and RSI momentum to generate reliable trading signals. The indicator is designed to help traders stay in strong trends, while filtering out weaker signals that don't meet strict criteria. By not displaying the RSI directly and keeping the chart focused on key signals, this script maintains a clean and functional trading setup.
This indicator is best used by traders who prefer clear visual guidance for buying and selling opportunities, especially in trending markets.
---
Feel free to adjust the parameters to suit your specific trading style! Let me know if you'd like any additional features or modifications.
Supertrend (Buy/Sell) With TP & SLSupertrend (Buy/Sell) with TP & SL: An Enhanced Trading Tool
This Pine Script indicator combines the popular Supertrend indicator with multiple take-profit (TP) and stop-loss (SL) levels, providing traders with a comprehensive visual aid for potential entries, exits, and risk management.
Originality
Buffer Zones for Precision: Instead of relying solely on the Supertrend line, this script incorporates buffer zones around it. This helps filter out false signals, especially in volatile markets, leading to more accurate buy/sell signals.
Flexible Stop-Loss: Offers the choice between a fixed or trailing stop-loss, allowing traders to tailor their risk management approach based on their preferences and market conditions.
Multiple Take-Profit Levels: Provides three potential take-profit levels, giving traders the flexibility to secure profits at different stages of a trend.
Heikin Ashi Candles & VWAP: Incorporates Heikin Ashi candles for smoother trend visualization and adds a VWAP line for potential support/resistance levels.
Clear Table Display: Presents key information like Stop Loss and Take Profit levels in a user-friendly table, making it easier to track trade targets.
How It Works
Supertrend Calculation: The Supertrend is calculated using ATR (Average True Range) to gauge market volatility. The script then creates buffer zones around the Supertrend line for refined signal generation.
Buy/Sell Signals:
Buy: When the close price crosses above the upper buffer zone, indicating a potential uptrend.
Sell: When the close price crosses below the lower buffer zone, suggesting a potential downtrend.
Take Profit & Stop Loss:
Take Profits: Three TP levels are calculated based on ATR and a customizable profit factor.
Stop Loss: The stop-loss can be set as either a fixed value based on ATR or as a trailing stop-loss that dynamically adjusts to lock in profits.
How To Use
Add the Indicator: Search for "Supertrend (Buy/Sell) With TP & SL" in the TradingView indicators list and add it to your chart.
Customize Inputs: Adjust parameters like ATR Period, Factor, Take Profit Factor, Stop Loss Factor, Stop Loss Type, etc., based on your trading style and preferences.
Interpret Signals: Look for buy signals when the price crosses above the upper buffer and sell signals when it crosses below the lower buffer.
Manage Risk: Use the plotted Take Profit and Stop Loss levels to manage your risk and potential rewards.
Concepts
Supertrend: A trend-following indicator that helps identify the direction of the prevailing trend.
ATR (Average True Range): A measure of market volatility.
Buffer Zones: Used to filter out false signals by creating a zone around the Supertrend line.
Trailing Stop Loss: A dynamic stop-loss that moves with the price to protect profits.
Heikin Ashi: A type of candlestick chart designed to filter out market noise and make trends easier to identify.
VWAP (Volume Weighted Average Price): An indicator that shows the average price at which a security has traded throughout the day, based on both volume and price.
Important Note: This script is for educational and informational purposes only. Backtest thoroughly and use with caution in live trading. Always manage your risk appropriately.

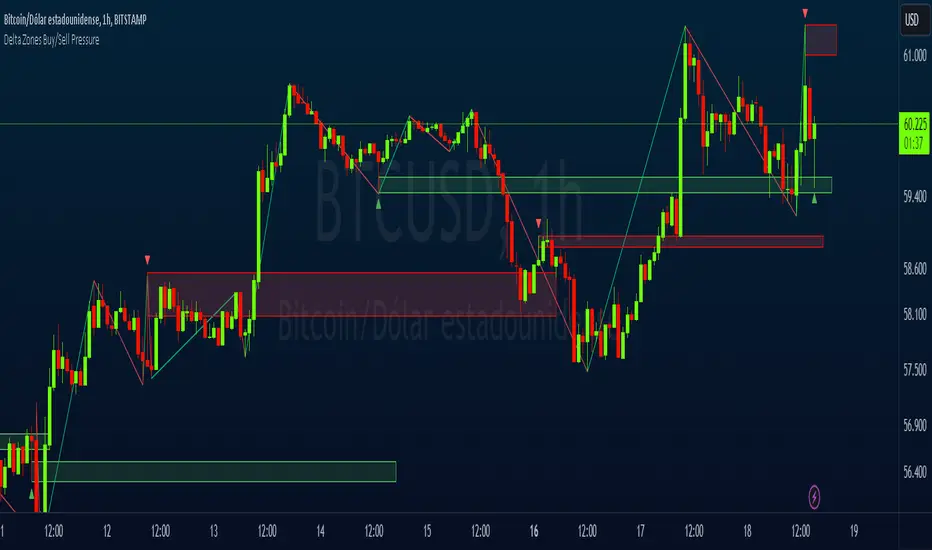
Delta Zones Buy/Sell PressureScript Description:
Delta Zones Buy/Sell Pressure Indicator
Description:
The "Delta Zones Buy/Sell Pressure" indicator, created by the original author "scarf", is a technical tool that unveils key areas of buying and selling pressure in the market. This indicator utilizes the concept of Delta, calculating differences between open, close, high, and low prices. When these differences exceed a threshold determined by the user-defined standard deviation, areas of intense buying (indicated by green boxes) and selling pressure (indicated by red boxes) on the chart are identified.
How It Works:
The indicator calculates Delta using various combinations of candle prices to determine buying and selling pressure. When Delta surpasses a certain level, indicated by the user-defined standard deviation, visual signals in the form of boxes on the chart are generated. These boxes highlight specific areas where buying or selling pressure is particularly strong, aiding traders in identifying potential entry and exit points in the market.
How to Use:
* When a green box is drawn, it indicates strong buying pressure in the market. This can be interpreted as a signal to consider long positions.
* When a red box is drawn, it indicates strong selling pressure in the market. This can be interpreted as a signal to consider short positions.
* Use these signals in combination with your own analysis and risk management strategies to make informed trading decisions.
Originality:
What makes this indicator original is its unique approach to identifying specific areas of buying and selling pressure. By calculating Delta in multiple ways and utilizing standard deviation as a filter, this indicator provides clear and concise visual signals about market activity. The combination of these features distinguishes it as a valuable tool for traders seeking a better understanding of market behavior. This modification differs from the original by displaying the information on the price chart with horizontal bars, below each delta, instead of an oscillator at the bottom similar to the volume indicator.
Final Recommendations:
Consider Market Trends:
Before making any trading decisions using the Delta Zones Buy/Sell Pressure Indicator, it is crucial to analyze the prevailing market trends. Assess the overall direction of the market, whether it's trending upward, downward, or moving sideways. Align your trades with the dominant trend to increase the probability of successful outcomes. The indicator's signals can be more reliable when they align with the broader market trend.
Evaluate Macro-Economic Factors:
Additionally, take into account macro-economic factors that could influence price movements. Factors such as economic indicators, geopolitical events, interest rate decisions, and global market sentiments can significantly impact the financial markets. Stay updated with relevant news and economic reports to anticipate potential market shifts. Understanding the broader economic context can help you interpret the indicator's signals within a more informed framework.
Practice Risk Management:
Regardless of the signals provided by the Delta Zones Buy/Sell Pressure Indicator, always implement effective risk management strategies. This includes setting stop-loss orders, diversifying your portfolio, and only risking a small percentage of your trading capital on each trade. By managing your risk, you can protect your investments and ensure longevity in the market, even during volatile periods.
Continuous Learning and Adaptation:
Financial markets are dynamic and constantly evolving. Continuously educate yourself about new trading strategies, technical analysis tools, and economic developments. Stay open to adapting your trading approach based on changing market conditions. Regularly reviewing your trading strategy and adjusting it according to your experiences and market feedback can significantly enhance your trading performance over the long term.
Seek Professional Advice if Necessary:
If you are uncertain about specific market trends, indicators, or economic factors, don't hesitate to seek guidance from financial advisors or professionals. Their expertise can provide valuable insights and help you make well-informed decisions, especially in complex or uncertain market environments.
By incorporating these recommendations into your trading approach, you can enhance your decision-making process, mitigate risks, and increase your overall chances of successful trading outcomes. Remember, the key to successful trading lies not only in the tools you use but also in your ability to interpret them within the broader market context.
VANILLA BUY SELLThis script uses three components:-
USEFUL MA by @ALEXGROVER
SUPERTREND INDICATOR(3 supertrend with different ATR and multiplier) provided by tradingview.
VIX FEAR GAUGE by @bizkitbr
To make it easy and line free, supertrend lines have been removed but the color fill has been kept. This makes the chart clean.
For option traders, direction and momentum is everything. Hence, two need to be really clear:-
a) BUY OR SELL
b) Whether momentum exists of not
While rise is charecterised by a steady pace, a fall is charecterized by a rapid decline.
So in order to make the best use of of the charecters, a careful interpretation and backtesting has been done to enable buy sell only when vix conditions are met.
BUY SIGNAL
A buy signal is generated on following conditions:-
a)PRICE CLOSE ABOVE USEFUL MA
B)ALL THREE SUPERTRENDS ARE GREEN
C)VIXFIX IS BELOW 0.18.
SELL SIGNAL
This is generated when following is met:-
A) PRICE BELOW USEFUL MA
B)ALL THREE SUPERTRENDS ARE RED
C)VIXFIX IS ABOBE 0.18
ADDITIONALLY, A SMALL BACKGROUND COLOR CHANGE PROVIDED FOR AREAS WHERE THERE IS A BUY OR SELL.
Either labels can be used or background colours referred for seeing buy or sell.
HMA Breakout Buy/Sell indicator for Scalping & Intraday - ShyamHi All,
This is a very simple indicator which provides the buy signal, when the moving average lines turns Green and sell signal, when the moving average signal turns red. This can be used for both intraday and scalping method with different timeframes. But best time frame is 5 minutes.
Buy Signal >>> Line turns GREEN (Use trailing SL to cover maximum profit)
Sell Signal >>> Line turns RED (Use trailing SL to cover maximum profit)
No trade >>> Line turns GRAY
Best timeframe >>> 5 minutes
Thanks,
Shyam

TDI - Traders Dynamic Index + RSI Divergences + Buy/Sell SignalsTraders Dynamic Index + RSI Divergences + Buy/Sell Signals
Credits to LazyBear (original code author) and JustUncleL (modifications)..
I added some new features:
1- RSI Divergences (Original code from 'Divergence Indicator')
2- Buy/Sell Signals with alerts (Green label 'Buy' - Red label 'Sell')
3- Background colouring when RSI (Green line) crosses above MBL (yellow line)
- Buy and Sell Signals are generated using Dean Malone's method (The Author of the TDI indicator) as mentioned in his PDF: (( www.forexfactory.com )), according to:
** Buy (Green Label) = RSI > 50, Red line, & Yellow line
** Sell (Red Label) = RSI < 50, Red line, & Yellow line
- I found that the best quality long trades generated when RSI crosses above red line, yellow line and they are all above 50, and vice versa for sell trades.
-I figured out another way to generate Buy/Sell Signals when RSI crosses above the yellow line, and you can stay with the trade till RSI crosses under the yellow line (I made a background colouring for that to be easily detected)
Hope you all wonderful trades..
مؤلف المؤشر هو (Dean Malone)
وكتب LazyBear كوده في tradingview
وأضاف JustUncleL بعض التعديلات عليه
أضفت إليه بعض المزايا الأخرى المتمثلة في:
1- رصد انحرافات مؤشر القوة النسبية
2- إشارات بيع وشراء بناء على طريقة مؤلف المؤشر
3- تظليل بالأخضر للمنطقة التي يعبر فيها مؤشر القوة النسبية الخط الأوسط (الخط الأصفر)
إشارات البيع والشراء تكون كالتالي:
** الشراء عندما يكون مؤشر القوة النسبية فوق الخط الأحمر وفوق خط الـ 50 وفوق الخط الأصفر
** البيع عندما يكون مؤشر القوة النسبية تحت الخط الأحمر وتحت خط الـ 50 وتحت الخط الأصفر
** أفضل إشارات الشراء حينما يعبر مؤشر القوة النسبية فوق الخط الأحمر والأصفر، ويكونوا جميعا فوق خط الـ 50، والعكس بالنسبة لإشارات البيع
يمكن استخدام المؤشر في دخول صفقات متوسط المدى، وذلك عندما يعبر مؤشر القوة النسبية فوق الخط الأصفر (قمت بتظليل المنطقة بالأخضر لسهولة رصدها) والخروج من الصفقة إذا نزل مؤشر القوة النسبية عن الخط الأصفر،
يرجى التنبه إلى أن الدخول والخروج يكون بأسباب فنية مدروسة، والمؤشر يدعم قراراتك فقط، ولا يمكن الاعتماد عليه منفردا في تحديد نقاط الدخول أوالخروج.
تجارة موفقة لكم جميعا :)

Day's Buy Sell Volume label
This indicator looks simple but it was bit tricky to code and to make it work on all time frames .
I have used array in this to showcase the use of array, array give you more flexibly.
It works on all time frame 1m 2m 3m 5m 10m 15m 30m 60m 120m.
When the time frame is greater than the or equal to "D" it will show the current bar volume only.
Total volume is made up of buying volume and selling volume. Buying volume is the number of shares, contracts, or lots that were associated with buying trades, and selling volume is the number that were associated with selling trades.
This indicator shows two labels green one is showing the buying volume of the current day and the red label is showing the selling volume of the current day.
I am making this code available to all.
This code is for Total volume is made up of buying volume and selling volume. Buying volume is the number of shares,
contracts, or lots that were associated with buying trades, and selling volume is the number that were associated with selling trades.
//thanks to @Doc6272 who asked to make this indicator Label
